Risk management in trading: the rules and a free checklist
Written by an ex-institutional trader. The risk rules that decide whether a trading account survives, each worked through in Australian dollars: how much to risk, how to size from the stop, loss limits, correlation, leverage and gap risk. Plus a free one-page checklist to print and keep next to your charts.
Direct answer
Risk management in trading is the set of rules that caps how much you can lose on any one trade, any one day and any one run of bad trades, so that a losing streak costs you a manageable slice of the account rather than the account itself. The core rules: risk about 1% of your balance per trade (2% at most), size every position from the stop loss rather than from the profit target, always trade with a stop, keep total open risk to around 3%, and stop for the day once you hit a set loss limit.
On a A$10,000 account, 1% is A$100 per trade. Ten losses in a row at that size leave about A$9,044. At 5% per trade, the same streak leaves about A$5,987, which then needs a 67% gain just to get back to where you started. There is a free printable risk management checklist (PDF) below that runs through every rule before, during and after a trade.
What risk management means in trading
Risk management is the part of trading that decides how much you lose when you are wrong. Entries get the attention, but entries decide whether a trade makes money; risk rules decide whether the account is still open in a year. You will be wrong often. Even good strategies lose on 40% to 60% of trades, so the question is never whether losses come, only how big they are when they do.
When I traded allocated institutional capital at a Sydney proprietary trading firm, the risk limits were fixed before the session started: how much any one position could lose, how much the book could lose in a day, and what happened when that number was hit. Nobody negotiated them mid-trade. That is the whole idea, carried over to a retail account: decide the loss in advance, when you are calm, and let the rules make the decisions when you are not.
The maths shows why. Losses and gains are not symmetrical. Lose 10% and you need 11.1% to get back to the start. Lose 20% and you need 25%. Lose 50% and you need 100%, which is to say you need to double what is left.
Everything below is about keeping the account on the flat left-hand side of that curve. If you want to run your own numbers, the drawdown recovery calculator does it for any loss size.
Disclosure: SatoshiMacro may earn a commission if you open a broker account through links on this page, at no extra cost to you. See our full affiliate disclosure.
Rule 1: risk 1% per trade, 2% at most
Pick a fixed percentage of the account that you are prepared to lose if a trade hits its stop, and never go above it. For most retail traders that should be 1%, and 0.5% while you are still learning. Two percent is the ceiling, not the target.
On a A$10,000 account, 1% is A$100. That number is the loss if the stop is hit, not the size of the position. You can hold a position worth tens of thousands of dollars and still only risk A$100, because the stop decides where the loss ends.
Why so small? Losing streaks. A strategy that wins 40% of its trades will, over 250 trades, produce a run of at least eight straight losses more than 80% of the time, and a run of ten about 45% of the time. Streaks like that are what a normal year looks like. Here is the same ten-loss streak at two risk levels:
The trader at 1% has had a bad fortnight. The trader at 5% has a problem that could take a year to fix, and is now trading under the kind of pressure that produces worse decisions. The table carries the same logic across more risk levels and longer streaks:
| Risk per trade | After 5 losses | After 10 losses | After 15 losses |
|---|---|---|---|
| 0.5% | A$9,752 | A$9,511 | A$9,276 |
| 1% | A$9,510 | A$9,044 | A$8,601 |
| 2% | A$9,039 | A$8,171 | A$7,386 |
| 3% | A$8,587 | A$7,374 | A$6,333 |
| 5% | A$7,738 | A$5,987 | A$4,633 |
| 10% | A$5,905 | A$3,487 | A$2,059 |
At 10% per trade, fifteen losses leave about a fifth of the account. People who trade that size usually do not get to fifteen; they blow up earlier, or they change strategy halfway through the streak and lock in the damage. For the probability side of this, the risk of ruin calculator shows how the chance of losing a set share of the account climbs as risk per trade rises.
Rule 2: size the position from the stop, not the target
This is the rule most beginners get backwards. They decide on a size first ("I trade one lot") and then put the stop wherever that size lets them afford it. The stop ends up in a random spot on the chart, and it gets hit by ordinary noise.
The right order is: find the price that proves the trade idea wrong, put the stop loss just beyond it, measure the distance, and only then work out the size.
Worked through for an Australian account. You have A$10,000 and risk 1%, so A$100. You want to buy EUR/USD, and the level that invalidates the idea puts your stop 25 pips below entry. On a standard lot of EUR/USD (100,000 euros), one pip is worth US$10. In Australian dollars that is US$10 divided by the AUD/USD rate: roughly A$14.30 with the Aussie near 0.70, and closer to A$15 when it sat around 0.66. The pip value is an approximation and moves every day with AUD/USD, which is why a calculator beats mental arithmetic.
One standard lot would lose 25 x A$14.30 = A$357.50 at the stop. You only want to lose A$100, so the size is A$100 / A$357.50 = 0.2797 lots. Round down to 0.27 lots, which puts about A$96.50 at risk. If AUD/USD fell to 0.65, the pip value would rise to about A$15.38 and the same trade would be 0.26 lots.
Notice what changed and what did not. A wider stop means a smaller position, a tighter stop a larger one, and the loss at the stop stays at A$100 either way. That is the entire point. The position size calculator handles the pip value conversion for AUD, USD and other account currencies, and the what is a lot guide explains the unit sizes if 0.27 lots means nothing to you yet.
Two things follow from this rule. First, every trade needs a stop, because without one there is no distance to size from and the risk is whatever the market decides. Second, you size from the stop, not the target. The target affects whether the trade is worth taking; it has nothing to do with how big it should be.
Rule 3: only take trades where the reward justifies the risk
Risk-reward compares what you stand to lose (entry to stop) with what you aim to make (entry to target). A 25-pip stop and a 50-pip target is 1:2. On its own the ratio means little. It only matters alongside your win rate, because the two trade off against each other. The breakeven win rate for any ratio is 1 / (1 + R), where R is the reward as a multiple of the risk.
My default minimum is 1:2, which needs a win rate of about 33.3% to break even. That leaves a margin for the trades you get wrong, plus spread and commission, which push the real breakeven a little higher than the clean formula. Treat it as a filter. A mean-reversion strategy that wins 60% of the time can live at 1:1, and a trend strategy that wins 30% needs better than 1:2. What you cannot do is combine a low ratio with a low win rate and hope.
To see what a given win rate and ratio actually earn per trade, use the expectancy calculator. The risk-reward ratio guide covers how to set targets that the chart can actually reach, which matters more than writing a big number on the ticket.
Rule 4: set daily and weekly loss limits
Per-trade risk is not enough on its own. Six trades at 1% each is a 6% day, and the trades that follow a bad morning are rarely the best ones you will take. Every desk has a daily loss limit for this reason: once the book is down a set amount, you are flat and finished for the day. No appeal, no "one more to get it back".
Sensible retail settings for a A$10,000 account at 1% per trade:
- Daily limit: 2%, or A$200. Two full losses and you stop.
- Two consecutive losses: stop, even if you are under the daily limit. Take a break and read the trades back before you go again.
- Weekly limit: 4% to 5%, or A$400 to A$500. Hit it and you sit out the rest of the week.
- Monthly drawdown of 10%: halve your risk per trade to 0.5% until the account recovers half the drop. This is the institutional version of a trader getting their allocation cut after a bad month.
These numbers are not magic. What matters is that you write them down before the week starts and treat them as fixed. The limit protects you from the version of yourself that shows up after three losses, which is the subject of the trading psychology guide. If you are trading a prop firm challenge, its daily loss rule does the same job, but set your own limit tighter than the firm's so you never get near the line.
Rule 5: cap total open risk and watch correlation
Risking 1% per trade only works if the trades are genuinely separate. Say you are long EUR/USD, long GBP/USD and long AUD/USD, each sized at 1%. That looks like three trades. It is one trade: short the US dollar, at 3%. A strong US payrolls number can stop out all three within the same minute.
Two rules handle this:
- Total open risk of around 3%. Add up the loss at the stop across every open position. If it is already 3%, a new trade waits until something closes or a stop moves to breakeven.
- Correlated positions count as one. If two or three trades depend on the same driver (the US dollar, risk appetite, oil), either pick the best one, or split your 1% between them. Long AUD/USD and long NZD/USD together is close to a double-sized AUD/USD trade.
The same applies across asset classes. Long the ASX 200, long AUD/JPY and long Bitcoin CFDs are three instruments that often move together on a risk-off day. Look at what would make each trade lose. If the answer is the same event, you have one position.
Rule 6: treat leverage, news and gaps as sizing inputs
Leverage is a result of your sizing, not a goal. ASIC caps retail CFD leverage at 30:1 on major currency pairs, 20:1 on minor pairs, gold and major indices, 10:1 on other commodities and minor indices, 5:1 on shares and 2:1 on crypto. Those are ceilings on what the broker will extend, not recommendations. The 0.27-lot EUR/USD trade above is 27,000 euros of exposure, roughly four to five times a A$10,000 account at recent exchange rates, and ties up somewhere around A$1,500 of margin at 30:1. The effective leverage fell out of the stop and the 1% rule; nobody chose it. If you size from the stop, leverage looks after itself. If you size from the maximum leverage available, you will eventually meet a margin call. The leverage guide covers the caps and margin maths in full.
Do not add to losing trades. Averaging down turns a 1% trade into a 2% or 3% trade exactly when the market is telling you the idea is wrong. Adding to a winner, with the stop on the original position moved to breakeven so total risk stays at 1%, is a different thing and fine within your rules.
Stops are not guaranteed through news and gaps. A normal stop becomes a market order when it is hit. In a fast release (US CPI, non-farm payrolls, an RBA decision) or over a weekend, price can jump past your stop and fill you several pips or more beyond it. That is slippage, and it means the loss can exceed your planned 1%. The fixes are simple: stay flat or smaller in the hour around high-impact releases, think twice before holding full size over a weekend, and use a guaranteed stop loss order where your broker offers one and the premium makes sense.
Know what negative balance protection does. Since 2021, ASIC's product intervention order requires CFD providers to give retail clients negative balance protection, so a gap cannot leave you owing the broker money. The same order makes brokers close positions once your equity falls below 50% of the margin required. Useful safety nets, both of them. Neither stops you losing the whole balance, so treat them as the last line of defence behind your own stops and sizing.
Free risk management checklist (PDF)
Rules only work if you run through them every time, including on the trades you are excited about. I put them on a single A4 page: what to confirm before every trade, what to do while it is open, the end-of-day review, the position size formula and a drawdown recovery table. Print it and keep it next to the screen, or save the image to your phone.
Risk management checklist
Free one-page PDF. Print it or keep it next to your charts. No signup.
Download the checklist (PDF)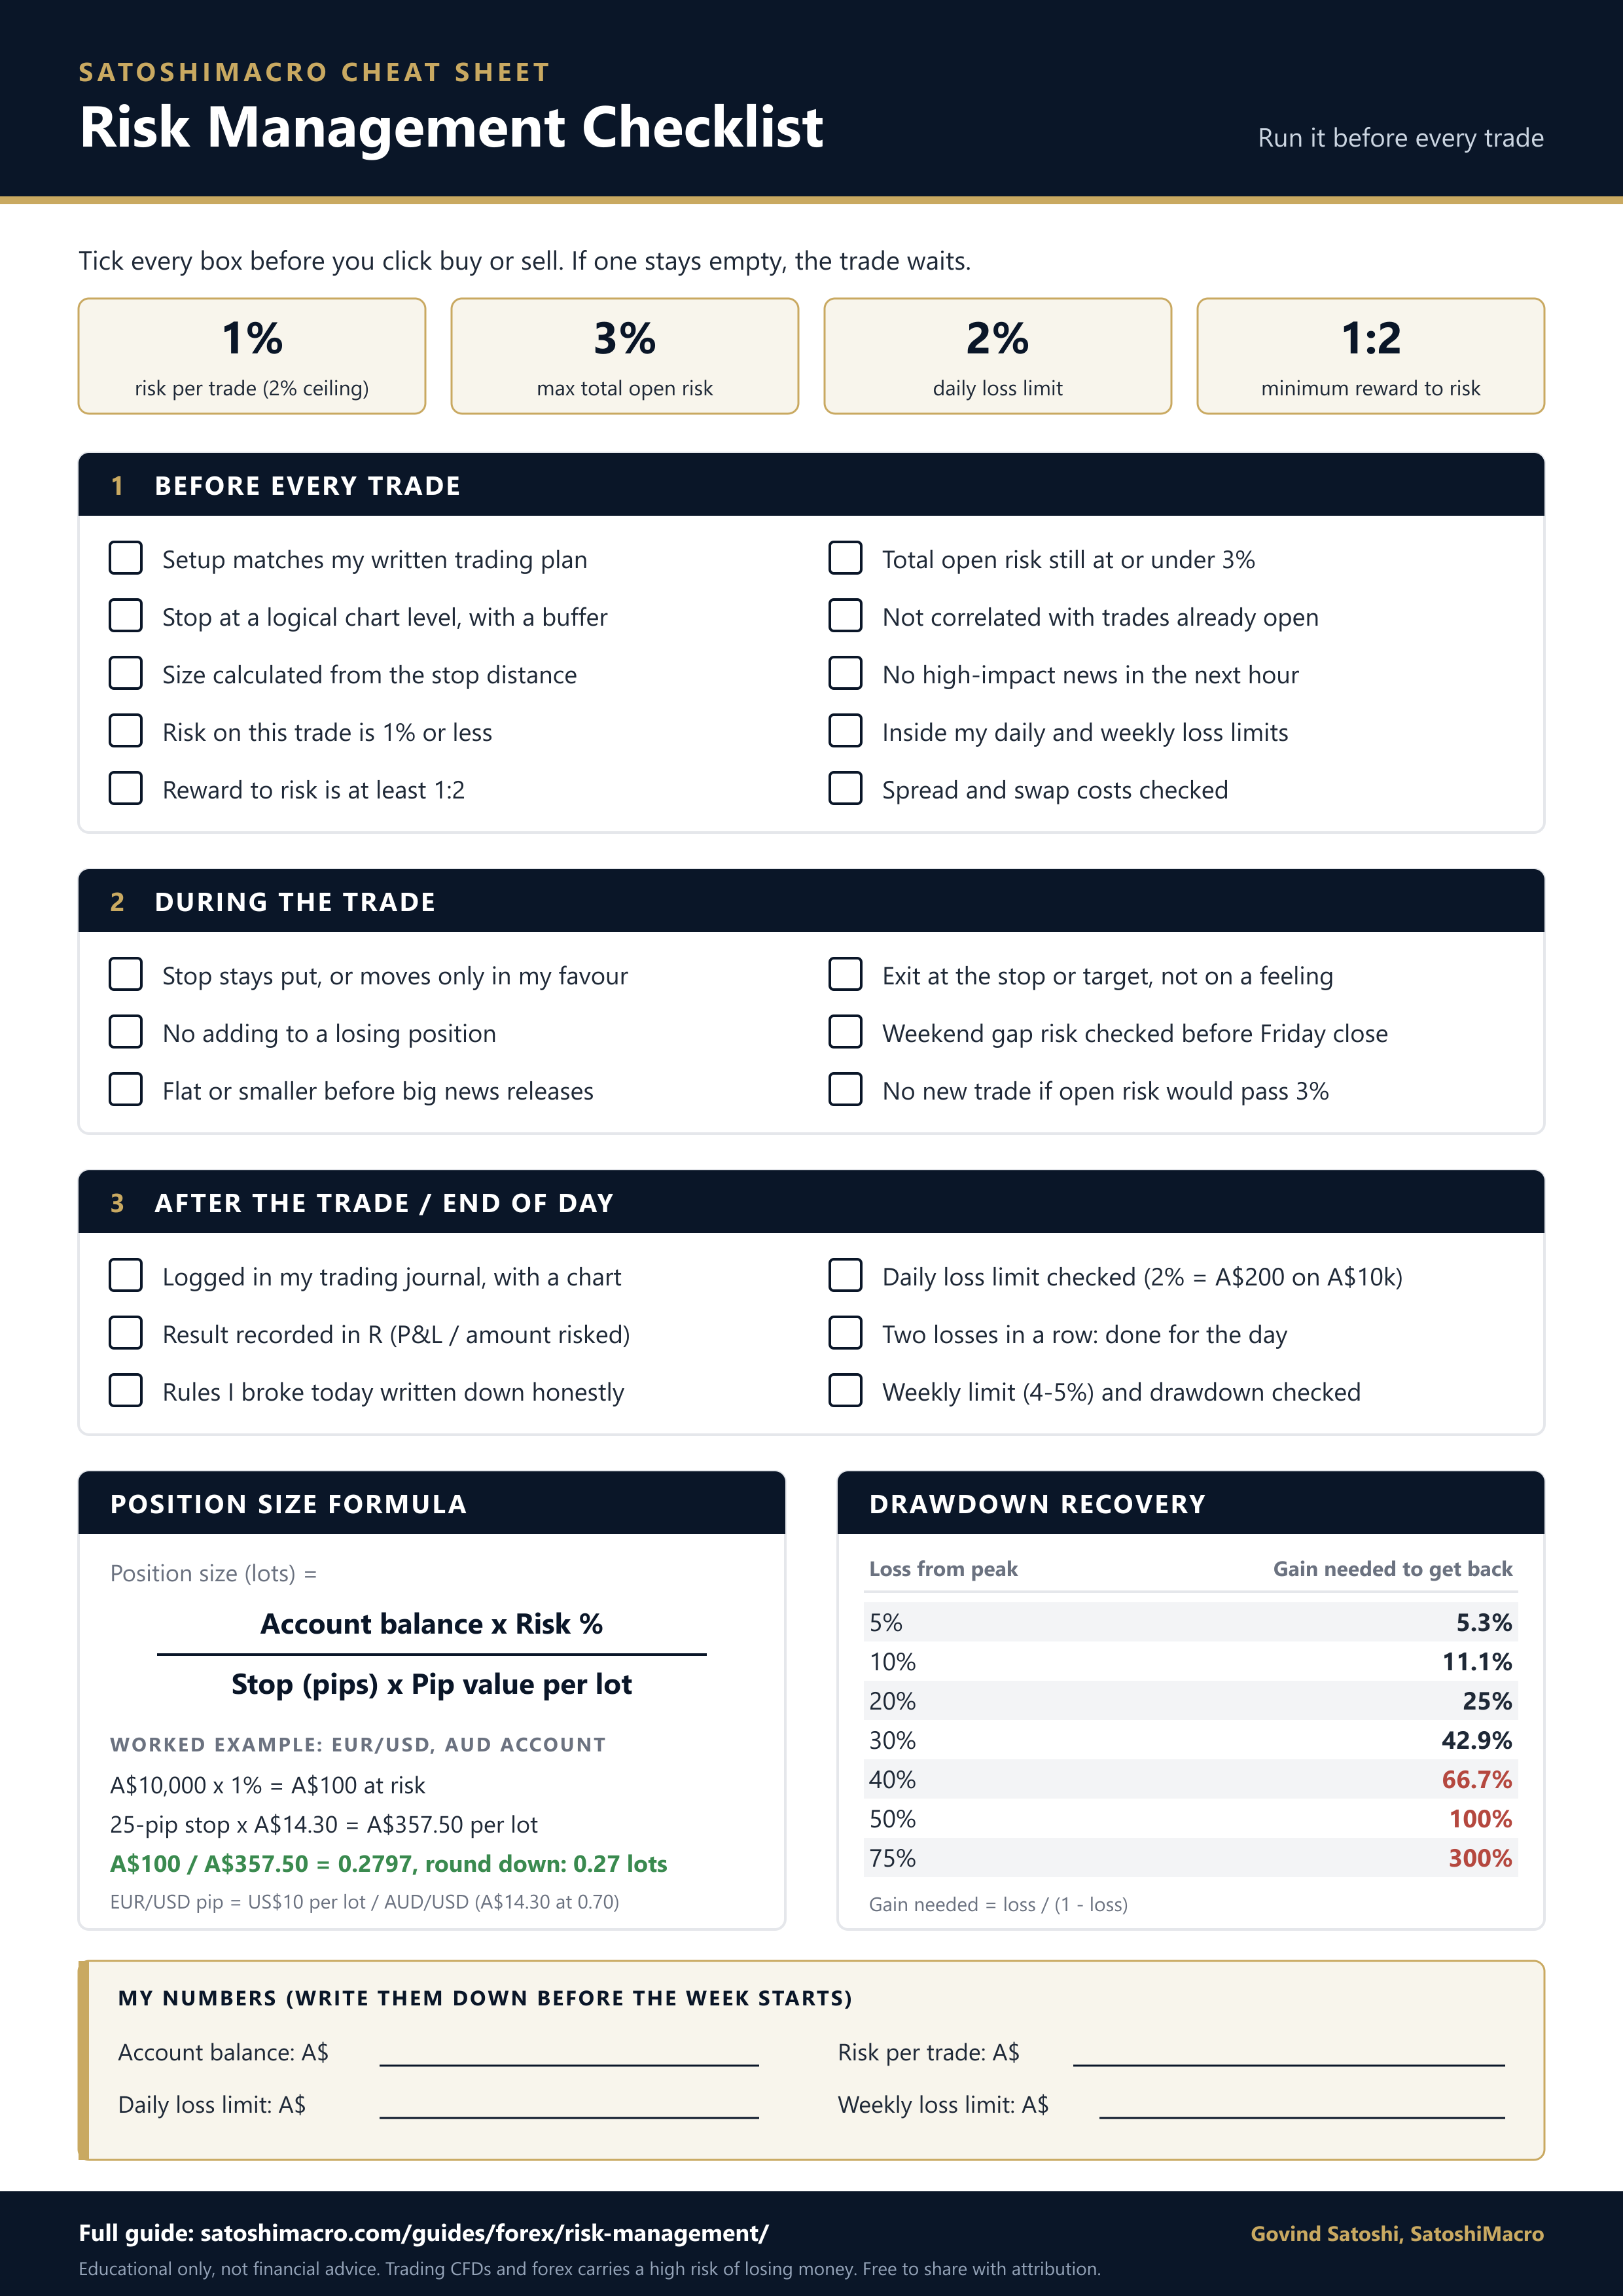
The checklist pairs well with a trading journal. The checklist stops bad trades going on; the journal shows you, a month later, which rules you broke and what it cost.
Common risk management mistakes
The same handful of errors shows up in almost every account that blows up:
- Sizing by feel. "I usually trade half a lot" is not a risk rule. Half a lot with a 10-pip stop and half a lot with a 60-pip stop are completely different bets.
- Moving the stop further away. Widening a stop to avoid being hit turns a planned 1% loss into an unplanned 3% one. Stops move only in your favour.
- Raising size after losses to win it back. This is how a 5% drawdown becomes a 25% one. If anything, risk should come down during a losing run, not up.
- Ignoring correlation. Three USD trades at 1% each is a 3% bet on one number.
- Forgetting costs. Spread, commission and overnight swap eat into every trade. On a tight 10-pip stop, a 1-pip spread is already 10% of your risk.
- Treating a demo result as proof. A few good weeks on demo say little. Risk rules earn their keep over hundreds of trades, which is why they have to be fixed before the results come in.
- Changing the rules mid-streak. Losing streaks are normal. Rewriting the strategy after six losses usually means abandoning it right before it would have recovered.
None of these needs a new indicator to fix. They need a rule written down in advance and followed when it is uncomfortable. If you want to go further than a flat 1%, the Kelly criterion calculator shows the theoretical optimal fraction for a given edge, and why most professionals use a fraction of Kelly rather than the full amount.
Get the rules right and the broker matters less than people think, but it still matters: tight spreads, reliable stop execution and negative balance protection are the basics. The best forex brokers in Australia ranking compares ASIC-regulated brokers on exactly those points.
Popular ASIC-regulated CFD brokers
All three are ASIC-regulated with free demo accounts. CFD Service. Your capital is at risk.
Examples use a A$10,000 account and are illustrative. Pip values are approximate and move with AUD/USD. Last reviewed: 2026-09-27.
Test your knowledge
A quick 5-question check on the key ideas above. Choose an answer for each, then check your score. Every answer is explained, and nothing is sent anywhere; it all runs in your browser.
Frequently asked questions
What is risk management in trading?
Risk management in trading is the set of rules that limits how much you can lose, decided before you place a trade. It covers how much of the account you risk per trade (usually 1% or less), where the stop loss goes, how big the position is, how much total risk you carry across open trades, and when you stop for the day. Its job is survival: keeping losses small enough that a normal losing streak never does damage the account cannot recover from.
What is the 1% rule in trading?
The 1% rule means you never lose more than 1% of your account balance on a single trade. On a A$10,000 account that is A$100. The rule does not limit position size directly; it limits the loss if the stop is hit, and the position is sized to fit. At 1% risk, ten losses in a row leave about 90.4% of the account, a drawdown most traders can recover from and keep trading through calmly.
How much should I risk per trade?
Most professional guidance, and my own practice, puts it at 0.5% to 1% of the account per trade, with 2% as a hard ceiling. Beginners should start at the low end until they have a few hundred trades logged. The reason is losing streaks: at a 40% win rate, a run of eight straight losses somewhere in 250 trades is more likely than not. At 1% that streak costs about 7.7%; at 5% it costs about a third of the account.
How do I calculate position size?
Position size equals the amount you are willing to lose divided by the stop distance multiplied by the value per pip. Example: a A$10,000 account risking 1% has A$100 to lose. With a 25-pip stop on EUR/USD and a pip value of about A$14.30 per standard lot, one lot would lose A$357.50 at the stop, so the size is A$100 divided by A$357.50, or 0.27 lots after rounding down. A position size calculator does this in seconds.
What is a good risk-reward ratio?
A minimum of 1:2 is a sensible default: you aim to make at least twice what you risk. At 1:2 you only need to win about 33.3% of trades to break even before costs, which leaves room for mistakes and spread. The right ratio depends on your win rate, though. A strategy that wins 60% of the time can work at 1:1, while one that wins 30% needs better than 1:2. Always judge the two numbers together.
What is a daily loss limit in trading?
A daily loss limit is a fixed amount you are allowed to lose in one day before you stop trading until the next session. A common setting is 2% to 3% of the account, or two to three losing trades at full risk. On a A$10,000 account risking 1% per trade, a 2% daily limit means you stop after losing A$200. It exists to stop revenge trading, because the worst decisions tend to come right after losses.
Is there a free risk management checklist PDF?
Yes. The SatoshiMacro risk management checklist is a free one-page A4 PDF, with a PNG version, on this page and needs no signup. It lists what to confirm before every trade (stop placed, size from the stop, risk at or under 1%, reward at least 1:2, total open risk at or under 3%, no correlated positions, no high-impact news), what to do during the trade, an end-of-day review, the position size formula and a drawdown recovery table.
Does negative balance protection mean I cannot lose money?
No. Negative balance protection, required for retail clients of ASIC-regulated CFD providers since 2021, means you cannot lose more than the money in your account. If a gap pushes your account below zero, the broker absorbs the difference. You can still lose the entire balance, and a single badly sized trade can do most of that damage. It is a safety net under the account, not a substitute for stops and position sizing.
