Chart patterns: a visual guide and cheat sheet
Written by an ex-institutional trader. Thirteen classic chart patterns, each drawn with its neckline or trendlines, the breakout point and the measured-move target, plus how to actually trade them and a free one-page cheat sheet. A reference for reading price, not a promise that shapes predict it.
Direct answer
A chart pattern is a recognisable shape that price traces over many bars, such as a head and shoulders, a double top, a triangle or a flag. Reversal patterns suggest a trend is ending, continuation patterns suggest a pause before the trend resumes, and bilateral patterns can break either way.
Every pattern is traded the same way: wait for a candle to close beyond the neckline or trendline, place the stop beyond the pattern where the idea is proven wrong, and aim for the measured move, which is the pattern's height projected from the breakout. Patterns shift the odds a little in your favour when they form at real levels and in line with the trend. They fail often enough that position size and a stop matter more than the shape.
What a chart pattern is
A chart pattern is a shape that price draws over many bars, usually somewhere between 15 and 100 candles, that has shown up often enough over the past century of charting to earn a name. Head and shoulders, double tops, triangles, flags. Each one has three working parts: a line that triggers the trade (a neckline or trendline), a point where the idea is proven wrong (where the stop goes), and a measured-move target based on the pattern's own height.
Patterns fall into three groups:
- Reversal patterns form at the end of a trend and suggest it is turning. Head and shoulders, double tops and bottoms, and wedges.
- Continuation patterns form mid-trend and suggest a pause before the trend carries on. Flags, pennants, ascending and descending triangles, and the cup and handle.
- Bilateral patterns have no built-in direction. The symmetrical triangle is the classic one: you trade whichever side breaks.
In the diagrams below, a green name means a bullish pattern, red means bearish and grey means it can go either way. The dot marks the breakout close, H is the height used for the target, and the dashed arrow shows the measured move.
Disclosure: SatoshiMacro may earn a commission if you open a broker account through links on this page, at no extra cost to you. See our full affiliate disclosure.
Why patterns work, and when they do not
Chart patterns are not magic geometry. They are a picture of order flow at levels. A double top is two separate attempts by buyers to push through the same price, both absorbed by sellers. A neckline is simply the support level under that fight. When it breaks, the traders who bought the second top are offside, their stops sit just below the neckline, and those stops turning into market sell orders is part of what gives the breakout its push.
That is also why patterns work better on liquid markets and higher timeframes. When I traded institutional size, the levels that mattered were the ones everyone could see on the daily chart, because that is where the resting orders were. A textbook triangle on a one-minute chart of a quiet cross has far less behind it.
The honest limit: patterns are probabilistic. Plenty of head and shoulders tops break the neckline and then rally straight back, and plenty of flags never break out at all. A pattern gives you a defined place to get in, a defined place to be wrong, and a sensible target. That framework is the real value, more than any predictive power in the shape itself.
Reversal patterns
Reversal patterns mark the point where a trend runs out of fuel. They need a trend to reverse, so a "head and shoulders" in the middle of a sideways range means very little.
Head and shoulders
Three peaks with a higher middle one. A close below the neckline marks a top.
Inverse head and shoulders
Three troughs with a lower middle one. A close above the neckline marks a bottom.
Double top
Two failed tests of the same high. Breaking the middle low confirms the top.
Double bottom
Two successful defences of the same low. Breaking the middle high confirms the bottom.
Rising wedge
Price grinds higher in a narrowing, upward-sloping range. Buying is tiring.
Falling wedge
Price slides lower in a narrowing, downward-sloping range. Selling is tiring.
How to trade them. The entry trigger is a candle closing through the neckline (or, for wedges, the trendline on the breakout side). The stop goes beyond the structure that would have to be retaken for the pattern to fail: above the right shoulder on a head and shoulders, above both tops on a double top, and the mirror image for the bullish versions.
The target is the measured move. On a head and shoulders, measure from the top of the head down to the neckline and project that distance down from the breakout. On AUD/USD, a head at 0.6900 over a neckline at 0.6700 gives a height of 200 pips, so a break at 0.6700 targets 0.6500. A double top at 1.2800 on GBP/USD with the middle low at 1.2650 is 150 pips high, so the target is 1.2500. Wedges are different: the usual target is a retrace to where the wedge began, because the whole grinding move inside it tends to unwind.
Continuation and bilateral patterns
Continuation patterns are pauses. The trend has made a strong move, early traders take profit, and price rests in a tight shape before the next leg. They are generally the better patterns to trade because you are going with the existing trend rather than calling its end.
Ascending triangle
Flat highs and rising lows. Buyers keep paying more until the ceiling gives way.
Descending triangle
Flat lows and falling highs. Sellers keep accepting less until the floor breaks.
Bull flag
A sharp rally, then a tidy pullback in a small down-sloping channel.
Bear flag
A sharp drop, then a weak bounce in a small up-sloping channel.
Pennant
A sharp move, then a small symmetrical squeeze. Usually resolves the same way.
Cup and handle
A rounded base, a shallow dip near the old high, then a push through the rim.
Symmetrical triangle
Lower highs and higher lows squeeze into a point. Can break either way.
How to trade them. The trigger is again a close beyond the pattern boundary in the direction of the trend. For flags and pennants the stop goes on the far side of the flag or pennant, and the target is the length of the pole projected from the breakout. The logic is that the second leg of the move often roughly matches the first.
For triangles, measure the height at the widest part (the start) and project it from the breakout. An ascending triangle on USD/JPY with flat resistance at 150.00 and a first low at 148.80 is 120 pips high, so a close above 150.00 targets 151.20. For the cup and handle, measure the depth of the cup from the rim and project it up from the rim break. The symmetrical triangle gets the same measured move, you just wait to see which side closes out first and trade that way.
How to trade a chart pattern, step by step
The mechanics are the same for all 13 patterns. Only the shape changes.
- Identify the pattern on a timeframe that matters. Four-hour and daily charts produce fewer patterns but far better ones. Check the higher-timeframe trend: continuation patterns should point with it, reversal patterns need a mature trend to reverse.
- Draw the trigger line. The neckline, the flat top of the triangle, the flag's upper edge. If you have to force the line through the bars to make it fit, it is not the pattern.
- Wait for a candle to close beyond the line. Not a touch, not an intraday spike. A close. This one rule removes a large share of false breakouts.
- Place the stop where the pattern is proven wrong. Beyond the flag, beyond the right shoulder, beyond the last swing inside the triangle. Read what a stop loss is if the idea of a hard exit is new.
- Set the target with the measured move, then check the risk-reward ratio. If the target is less than about 1.5 times the distance to the stop, the trade is usually not worth taking.
- Size the position so the stop costs a fixed small percentage. One per cent of the account is a sensible ceiling. The position size calculator does the arithmetic.
Here is that process on a bull flag in EUR/USD. The pair rallies from 1.0800 to 1.0900, a 100-pip pole. It then drifts lower in a tidy channel and the pullback finds buyers at 1.0870. The trigger is the flag's upper line, which by the time of the breakout has sloped down to 1.0885. A four-hour candle closes at 1.0885 above it.
- Entry: 1.0885, on the close.
- Stop: 1.0860, 10 pips under the 1.0870 flag low. Risk is 1.0885 minus 1.0860, which is 25 pips.
- Target: the 100-pip pole added to the breakout, 1.0885 plus 0.0100, which is 1.0985. That is 100 pips of reward against 25 of risk, a 4 to 1 ratio.
- Size: on an AUD 10,000 account risking 1%, the stop can cost AUD 100. EUR/USD pays USD 10 per pip per standard lot, about AUD 14.30 with AUD/USD near 0.70. So 100 divided by (25 x 14.30) is 0.2797, rounded down to 0.27 lots.
Measured moves are guides, not promises. Plenty of traders take half the position off at 2 to 1 (1.0935 here), move the stop to breakeven, and let the rest run at the full target. That turns a trade that stalls at 1.0950 into a winner rather than a round trip.
All 13 patterns compared
| Pattern | Type | Signal | Target method | Stop goes |
|---|---|---|---|---|
| Head and shoulders | Reversal | Bearish | Head to neckline, projected down | Above right shoulder |
| Inverse head and shoulders | Reversal | Bullish | Head to neckline, projected up | Below right shoulder |
| Double top | Reversal | Bearish | Tops to middle low, projected down | Above the tops |
| Double bottom | Reversal | Bullish | Lows to middle high, projected up | Below the lows |
| Rising wedge | Reversal | Bearish | Back to wedge start | Above last wedge high |
| Falling wedge | Reversal | Bullish | Back to wedge start | Below last wedge low |
| Ascending triangle | Continuation | Bullish | Widest height, from breakout | Below last higher low |
| Descending triangle | Continuation | Bearish | Widest height, from breakout | Above last lower high |
| Bull flag | Continuation | Bullish | Pole length, from breakout | Below flag low |
| Bear flag | Continuation | Bearish | Pole length, from breakout | Above flag high |
| Pennant | Continuation | With the pole | Pole length, from breakout | Far side of pennant |
| Cup and handle | Continuation | Bullish | Cup depth, from rim | Below handle low |
| Symmetrical triangle | Bilateral | Either way | Widest height, from breakout | Inside the triangle |
Free chart patterns cheat sheet
All 13 patterns on one A4 page: each diagram with its trigger line, breakout point and target, a one-line rule for entry and stop, and the four-step method for trading any pattern in a panel at the bottom. It prints cleanly in black and white too, since the bullish and bearish tags are spelled out.
Chart patterns cheat sheet
Free one-page PDF. Print it or keep it next to your charts. No signup.
Download the cheat sheet (PDF)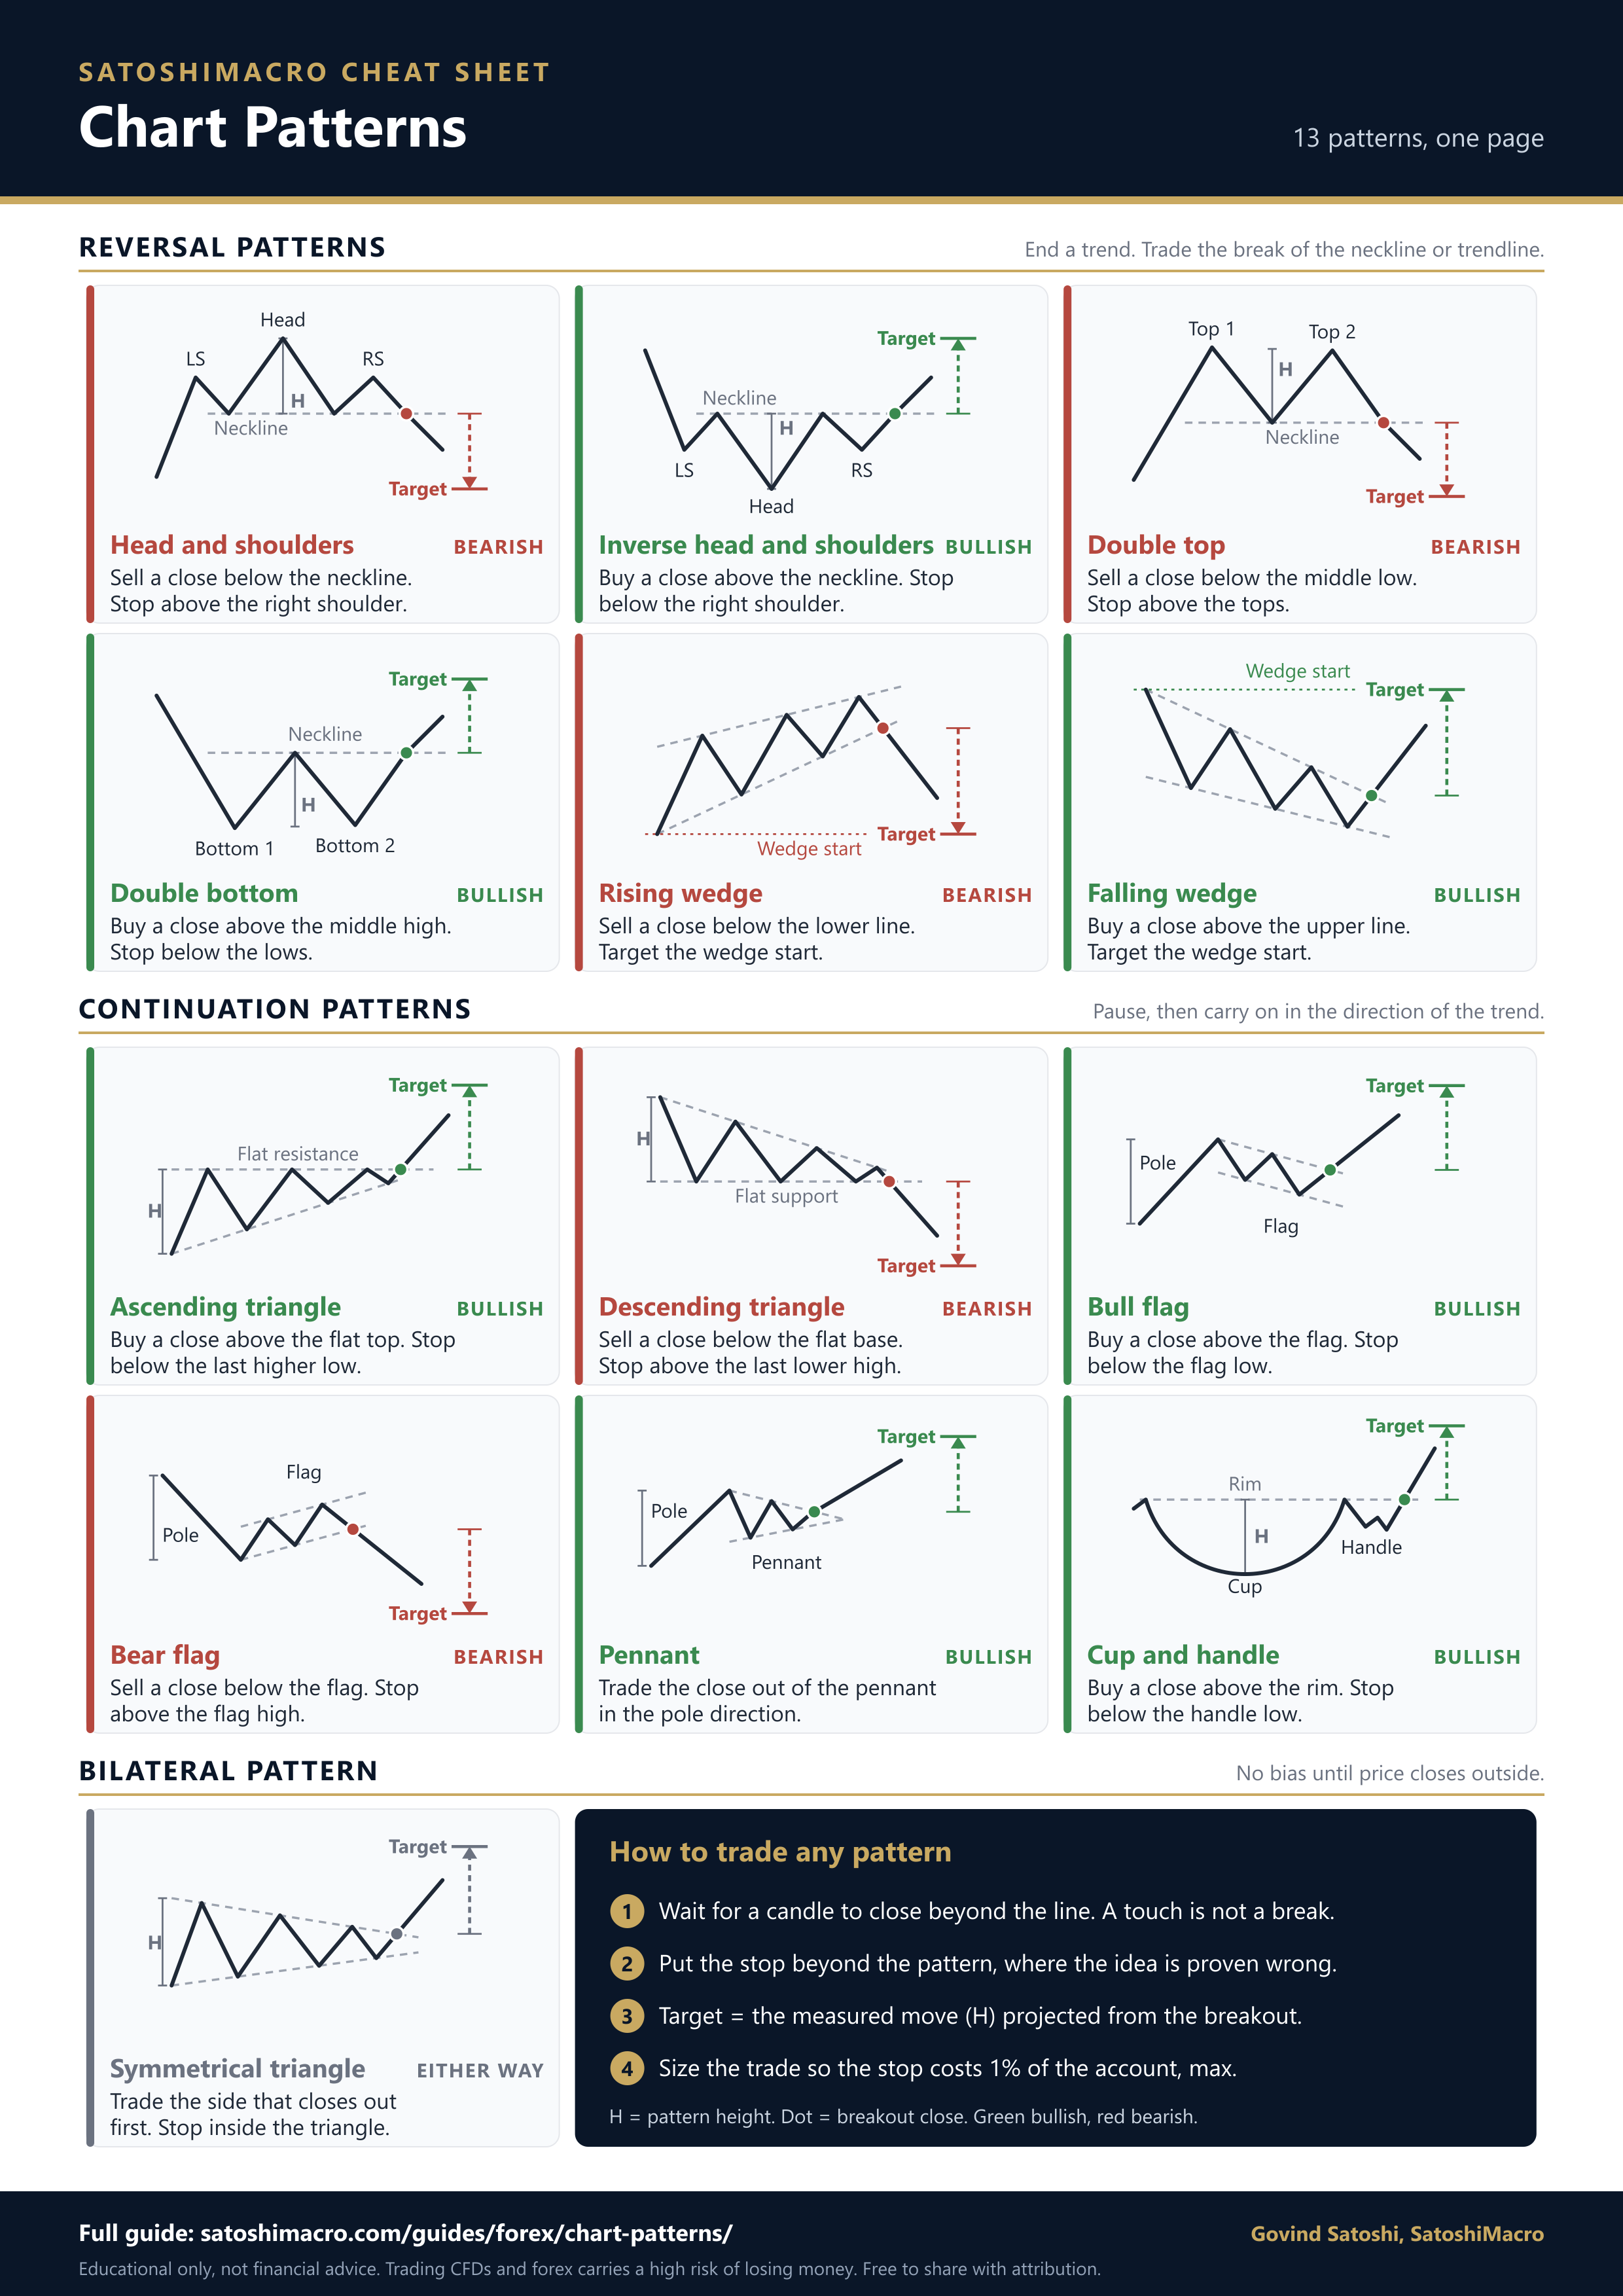
Common mistakes
- Trading before the breakout closes. Entering on the touch of a neckline, or on an intraday spike through it, is the most expensive habit in pattern trading. Many breaks reverse before the candle closes. Wait for the close.
- Seeing patterns everywhere. Once you learn the shapes, every wiggle starts to look like a head and shoulders. If the pattern only works after you redraw the line three times, or the shoulders are wildly different sizes, pass. The good ones are obvious.
- Ignoring the trend. A bull flag in a strong uptrend and a bull flag inside a falling market are not the same trade. Check the daily chart before acting on a four-hour pattern.
- No stop, or a stop moved. A failed pattern is information: the idea was wrong. Traders who drop the stop because the pattern "should" work turn a 1% loss into a 5% one.
- Oversizing because the setup looks perfect. The prettiest pattern still fails a good share of the time. Size every trade to the same small risk and let the numbers work across dozens of trades.
Where patterns fit
Chart patterns are one of the most useful ways to structure a trade, because they hand you an entry, a stop and a target before you risk anything. They are not a strategy on their own. Combine them with the trend, with real support and resistance levels, and with candlestick patterns at the trigger line for confirmation. The base rate stays unforgiving: most retail CFD and forex accounts lose money, and no pattern changes that without disciplined risk control.
Build the rest of the foundation with forex trading strategies, the risk-reward ratio and position sizing, and choose a broker with clean charting and tight spreads from the best forex brokers in Australia ranking.
Popular ASIC-regulated CFD brokers
All three are ASIC-regulated with free demo accounts. CFD Service. Your capital is at risk.
Diagrams are illustrative. Last reviewed: 2026-09-27.
Test your knowledge
A quick 5-question check on the key ideas above. Choose an answer for each, then check your score. Every answer is explained, and nothing is sent anywhere; it all runs in your browser.
Frequently asked questions
What are chart patterns in trading?
Chart patterns are recognisable shapes that price forms over many bars, such as head and shoulders, double tops and bottoms, triangles, flags, pennants, wedges and cup and handle. Traders group them into reversal patterns, which suggest a trend is ending, continuation patterns, which suggest a pause before the trend carries on, and bilateral patterns that can break either way. Each has a trigger line, a logical stop and a measured-move target, which is what makes them tradeable rather than just descriptive.
What is the most reliable chart pattern?
No pattern is reliable on its own, and anyone quoting a fixed success rate is overselling. In my experience the head and shoulders, the double top and bottom, and the bull or bear flag in a strong trend are the most useful because the trigger line and stop are obvious. Reliability comes from context: a pattern forming at a major daily support or resistance level, in the direction of the higher-timeframe trend, with a clean close through the line, beats any shape in isolation.
What does a head and shoulders pattern mean?
A head and shoulders is a topping pattern: three peaks where the middle one (the head) is higher than the two either side (the shoulders), with a neckline joining the lows between them. It shows buyers failing to make a new high on the right shoulder. The pattern is confirmed when a candle closes below the neckline. The usual target is the distance from the head to the neckline, projected down from the breakout. The inverse version marks a bottom.
What is a bull flag pattern?
A bull flag is a continuation pattern. Price rallies sharply (the pole), then drifts lower in a small, orderly channel (the flag) as early buyers take profit, before breaking out above the flag and resuming the rally. Traders buy a close above the flag's upper line, place the stop below the flag low, and target the length of the pole projected up from the breakout. A bear flag is the mirror image in a downtrend.
Which way do triangle patterns break?
It depends on the triangle. An ascending triangle, with flat highs and rising lows, is biased to break up. A descending triangle, with flat lows and falling highs, is biased to break down. A symmetrical triangle, where both lines converge, has no built-in bias and can break either way, although it often resolves in the direction of the trend that came before it. In every case, wait for a candle to close outside the triangle before acting.
Do chart patterns work in forex?
They work in forex as well as they work anywhere, which is to say as a probability edge, not a guarantee. Major pairs are liquid and widely charted, so levels like necklines and triangle boundaries attract real orders. Patterns on the four-hour and daily charts carry more weight than those on one-minute charts, where noise dominates. The catch is leverage: a failed pattern on a leveraged forex position can cost far more than it would unleveraged, so the stop and position size do the heavy lifting.
Is there a chart patterns cheat sheet PDF?
Yes. This page includes a free one-page chart patterns cheat sheet as a printable A4 PDF and a PNG image, with no signup. It shows all 13 patterns from this guide, grouped into reversal, continuation and bilateral, each with its trigger line, breakout point, measured-move target and a one-line trading rule, plus the four-step method for trading any pattern. Print it and keep it next to your screen while you learn to spot the shapes.
What is the difference between chart patterns and candlestick patterns?
Candlestick patterns are built from one to three individual candles and describe very short-term momentum, such as a hammer or an engulfing bar. Chart patterns are larger structures that form over dozens of candles, such as a head and shoulders or a triangle, and come with defined trigger lines, stops and measured-move targets. The two work well together: a candlestick signal at a chart pattern's neckline or trendline is a common way to confirm the breakout.
